How variable are the results?
This page tells you why and how we measure the variability of results as part of the New Zealand Crime and Safety Survey (NZCASS).
- Introduction to statistical variability and bias
- Why measure the variability of results?
- How to use sampling error information
- How to know if a difference or change is ‘real’ or not
- How to calculate different measures of variability
Introduction to statistical variability and bias
The NZCASS is a sample survey. This means that a sample of areas (meshblocks), households and people are selected from the New Zealand population using a set process. Sampling error arises because only a small part of the New Zealand population is surveyed, rather than the entire New Zealand population (census). Because of this, the results (estimates) of the survey might be different from the figures for the entire New Zealand population. The size of the sampling error depends on the sample size, the size and nature of the estimate, and the design of the survey.
Why measure the variability of results?
We need reliable information so we can give good advice and make good decisions. People using NZCASS results need to understand the size of an estimate’s sampling error so they can know:
- whether or not to use an estimate
- how to use an estimate
- whether differences between estimates are ‘real’ differences (or not)
- the type of conclusions, advice or decisions that can be made based on an estimate.
How to use sampling error information
To find out the difference between a survey estimate and the value that we would have got if a census had been done, we use two main measures in NZCASS reporting: Relative standard error (RSE) and Margin of error (MoE).
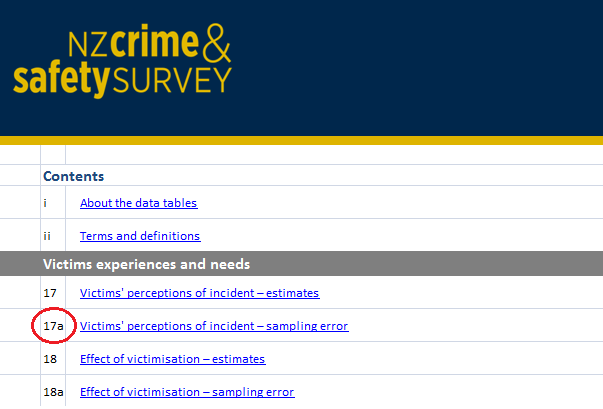
We have provided either the Relative standard error or the Margin of error for each estimate in the NZCASS data tables, so you can make an informed decision about the information you choose to use. You can find the sampling error for all estimates in the data tables labelled ‘a’. For example, the sampling error for table 17 is shown in table 17a.

Relative standard error (RSE)
In the NZCASS, the relative standard error is used to measure the variability of count estimates or means (rather than percentages). The relative standard error is reported as a percentage of the estimate – RSE = estimate / standard error of the estimate.
In NZCASS reporting:
- estimates with a relative standard error between 20% and 50% are considered high and are flagged with a hash symbol (#); we do not recommend using flagged estimates for official reporting (for example, ministerial reporting)
- estimates with a relative standard error over 50% are suppressed as they are considered too unreliable.
The NZCASS relative standard error is similar to the relative sampling error used by Statistics NZ, but is not the same.
Margin of error (MoE)
In the NZCASS, the margin of error is used to measure the reliability of percentage estimates (rather than counts or means) and to calculate confidence intervals. NZCASS reporting uses the 95% margin of error and this is calculated as the t-value (approximately 1.96) multiplied by the standard error – MoE = t-value * standard error of estimate.
In NZCASS reporting:
- estimates with a margin of error between 10 and 20% are considered high and should be viewed with caution
- estimates with a margin of error over 20% are suppressed as they are considered too unreliable for general use.
Data tables: examples of use
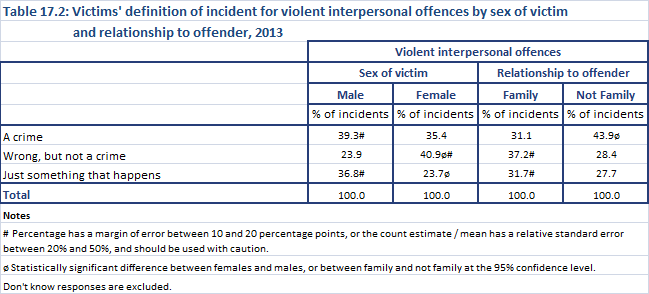
Looking at table 17.2 ‘Victims’ definition of incident for violent interpersonal offences, by sex of victim and relationship to offender, 2013’, we see that a number of figures are flagged with a hash (#) indicating that the percentage value has a margin of error of between 10 and 20%.

Say you were interested in knowing the percentage of women who were the victim of a violent interpersonal offence (in 2013) and thought that it was ‘wrong, but not a crime’. You would see that this figure was flagged with a hash (#), so you should look at table17.2a, which shows the margin of error for each figure.

As you can see, the margin of error for this figure (the percentage of women who were the victim of a violent interpersonal offence (in 2013) and thought that it was ‘wrong, but not a crime’) is 10.2%.
This means that you can be 95% sure of accuracy within plus or minus 10.2%. Put another way, you can be 95% confident that a complete census would reveal not less than 30.7% or more than 51.1% of women would see the offence as wrong, but not a crime.
Confidence intervals
Confidence intervals are also used to measure of an estimate’s reliability. A confidence interval expresses the sampling error as a range of values between which the ‘real’ population value is estimated to lie. The 95% confidence interval (CI) is used in NZCASS reporting, and is calculated as the estimate plus or minus the margin of error – CI = estimate ± MoE of the estimate.
Guidelines for using flagged estimates
We recommend that:
- you don’t use estimates flagged with a hash (#) symbol.
- if you must use a flagged estimate, then explain the figure fully in a sentence and state the sampling error so readers understand how variable the figure is. You can do this in several ways – see the two examples below:
- ‘Between 30.7% and 51.1% of women who experienced a violent interpersonal offence in 2013 said they thought the incident was “wrong, but not a crime”.’
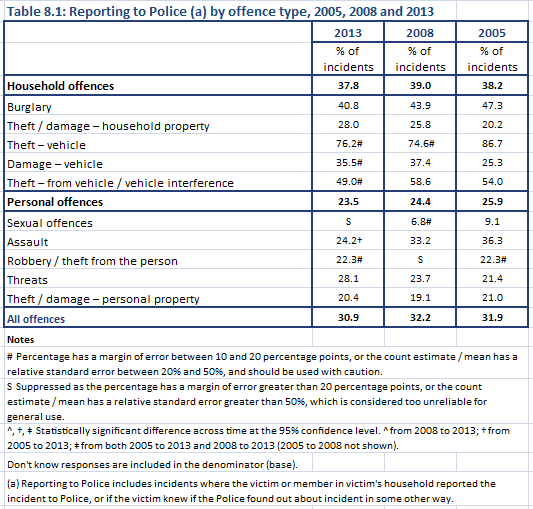
- ‘According to victims in the NZCASS, 22.3% (MoE ±19.4%) of offences that involved robbery or theft from the person were reported to Police in 2013.’
How to know if a difference or change is ‘real’ or not
As all NZCASS estimates are subject to survey error, the difference between two estimates may have happened by chance rather than being a real difference.

Data tables: examples of use
Looking at table 8.1 ‘Reporting to Police by offence type, 2005, 2008 and 2013’, we see that the percentage of burglaries reported to Police was estimated to be 40.8% in 2013 and 43.9% in 2008. While 40.8% is less than 43.9%, you can’t conclude that burglary reporting has decreased since 2008 because this difference may simply be due to chance (because the estimate was derived from a survey), rather than being a ‘real’ difference.
To understand if a difference between years or between groups is ‘real’ or not, we do statistical significance tests (‘significance testing’). All significance testing in the NZCASS 2014 was done at the 95% confidence level.
Results of significance testing are presented in the data tables through symbols for both comparisons across time and comparisons between different groups. For example, in table 8.1 above, you can see a cross (†) next to the assault estimate in 2013. The table footnotes say the 2013 estimate is significantly different from both 2005 and 2009. This means that we can say that reporting of assault to Police has significantly fallen over time and we’re confident to the 95% level that this is a ‘real’ trend downwards.
If the estimate does not have a symbol, then the difference is not statistically significant. For example, we have no evidence that the difference in reporting of burglaries to Police is statistically significant.
How to calculate different measures of variability
The NZCASS uses a confidence level of 95%. If you need a different confidence level, you can calculate them as follows:
- 90% confidence level: multiply the margin of error by a factor of 1.645 / 1.96
- 99% confidence level: multiply the margin of error by a factor of 2.576 / 1.96
We have used relative standard error (RSE) to measure the reliability of count estimates and means and margins of error (MoE) to measure the reliability of percentages. If you need to use a different measure, you can convert them using the following approximations:
- RSE to MoE: MoE ≈ (RSE * estimate) / 100 * 1.96
- MoE to RSE: RSE ≈ (MoE * 100) / (1.96 * estimate)
If you need different statistical significance tests, you can get a broad approximation by examining whether the confidence intervals overlap. If the intervals do not overlap, then it can be said the difference is statistically significant. If the intervals do overlap, then it is likely (but not definite) that the difference is not statistically significant.
Contact us if you need particular measures of variability or comparisons that you can’t calculate through the data tables.
Non-sampling error
The variability of results (sampling error) discussed on this page should not be confused with non-sampling error that also contributes to survey error. Non-sampling error includes inaccuracies that can arise through reporting to interviewers, respondents’ memory issues or fabricating information, errors in coding and processing, non-response bias and inadequate sampling frames. While inaccuracies of this kind may happen in any survey, strict quality processes have been undertaken in the NZCASS to minimise this type of error. While sampling error can be quantified, non-sampling error cannot.
This page was last updated:
